UK online clothing sales statistics 2026
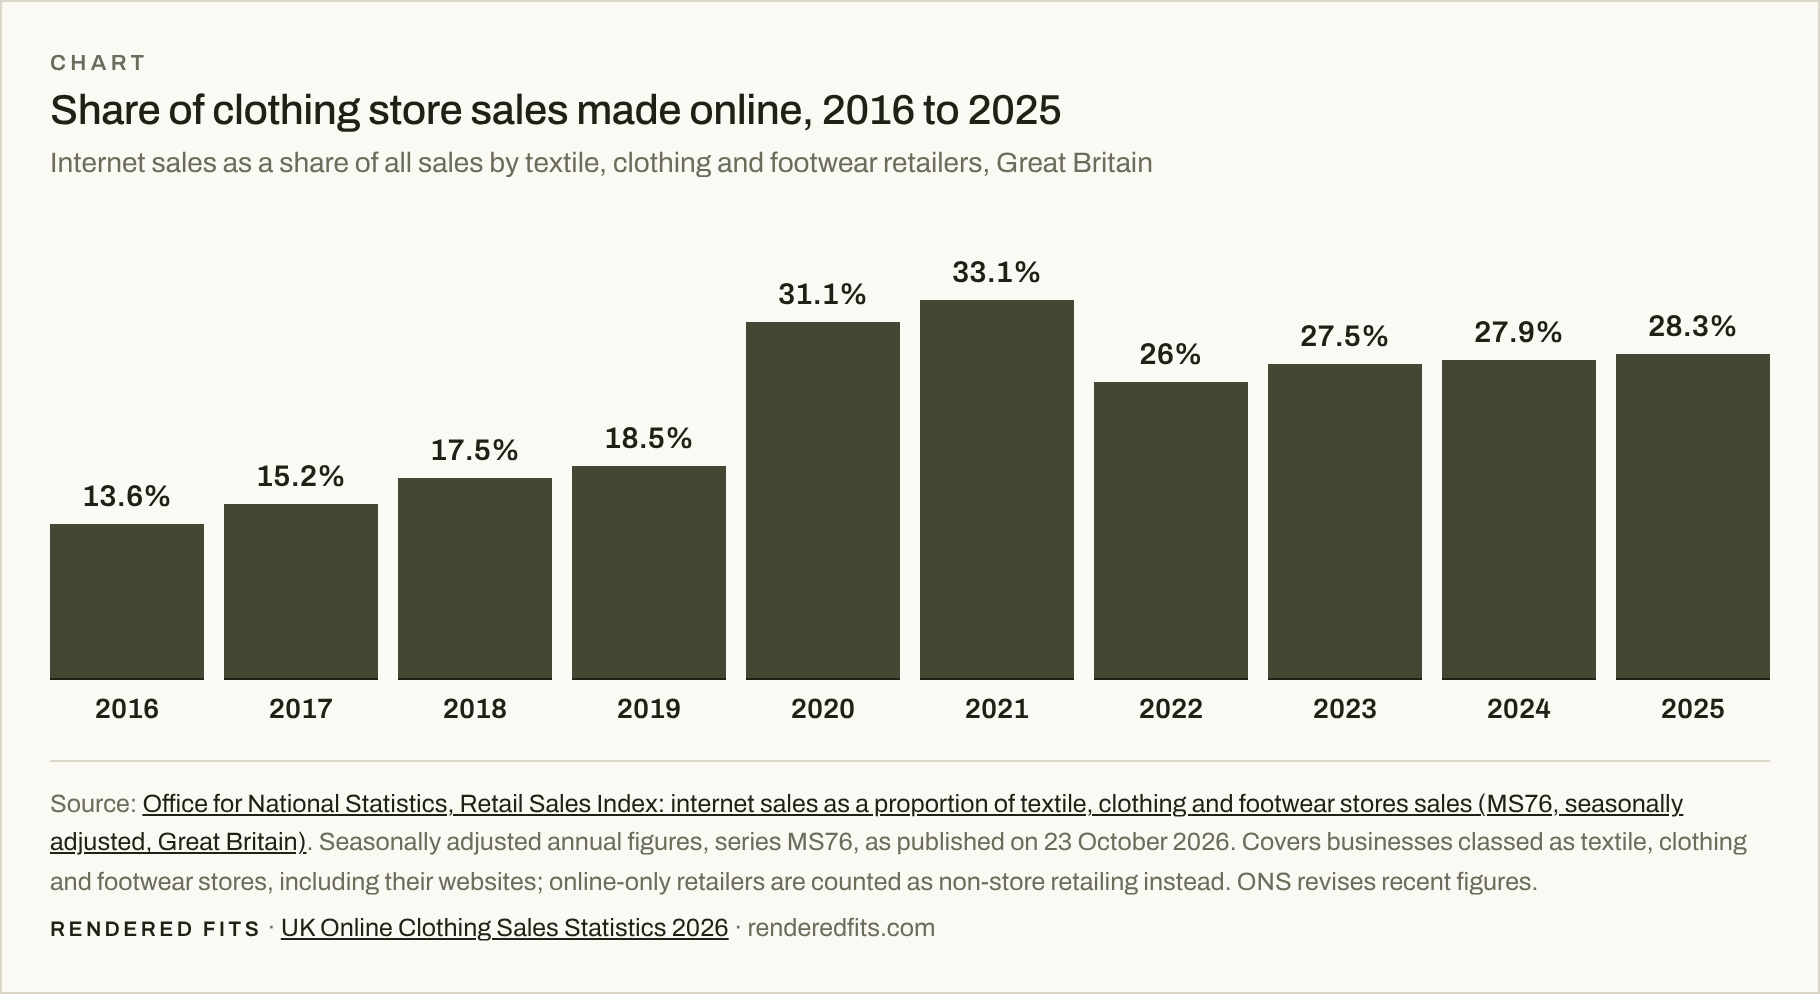
British clothing, textile and footwear retailers made 28.2% of their sales online in September 2026, according to the Office for National Statistics (ONS), against 18.5% in 2019 and a pandemic peak of 33.1% in 2021. More than half of UK online fashion sales (56.8%) now happen on a phone. Every figure on this page links to the data it comes from.
Director Sienna Stones was interviewed by Vogue College of Fashion (2 June 2026)
Key figures
Online has held between 26% and 29% of clothing store sales in Great Britain every year since 2022: well above the 2019 level, below the 2021 peak, and close to the 28.8% average for all retail.
- 28.2%of textile, clothing and footwear store sales made online, September 2026 (Great Britain)ONS
- 28.3%online share for the full year 2025, up from 18.5% in 2019ONS
- £317.1maverage weekly online sales by clothing, textile and footwear stores, September 2026ONS
- 56.8%of UK and Irish online fashion sales made on mobile, September 2026IRP Commerce
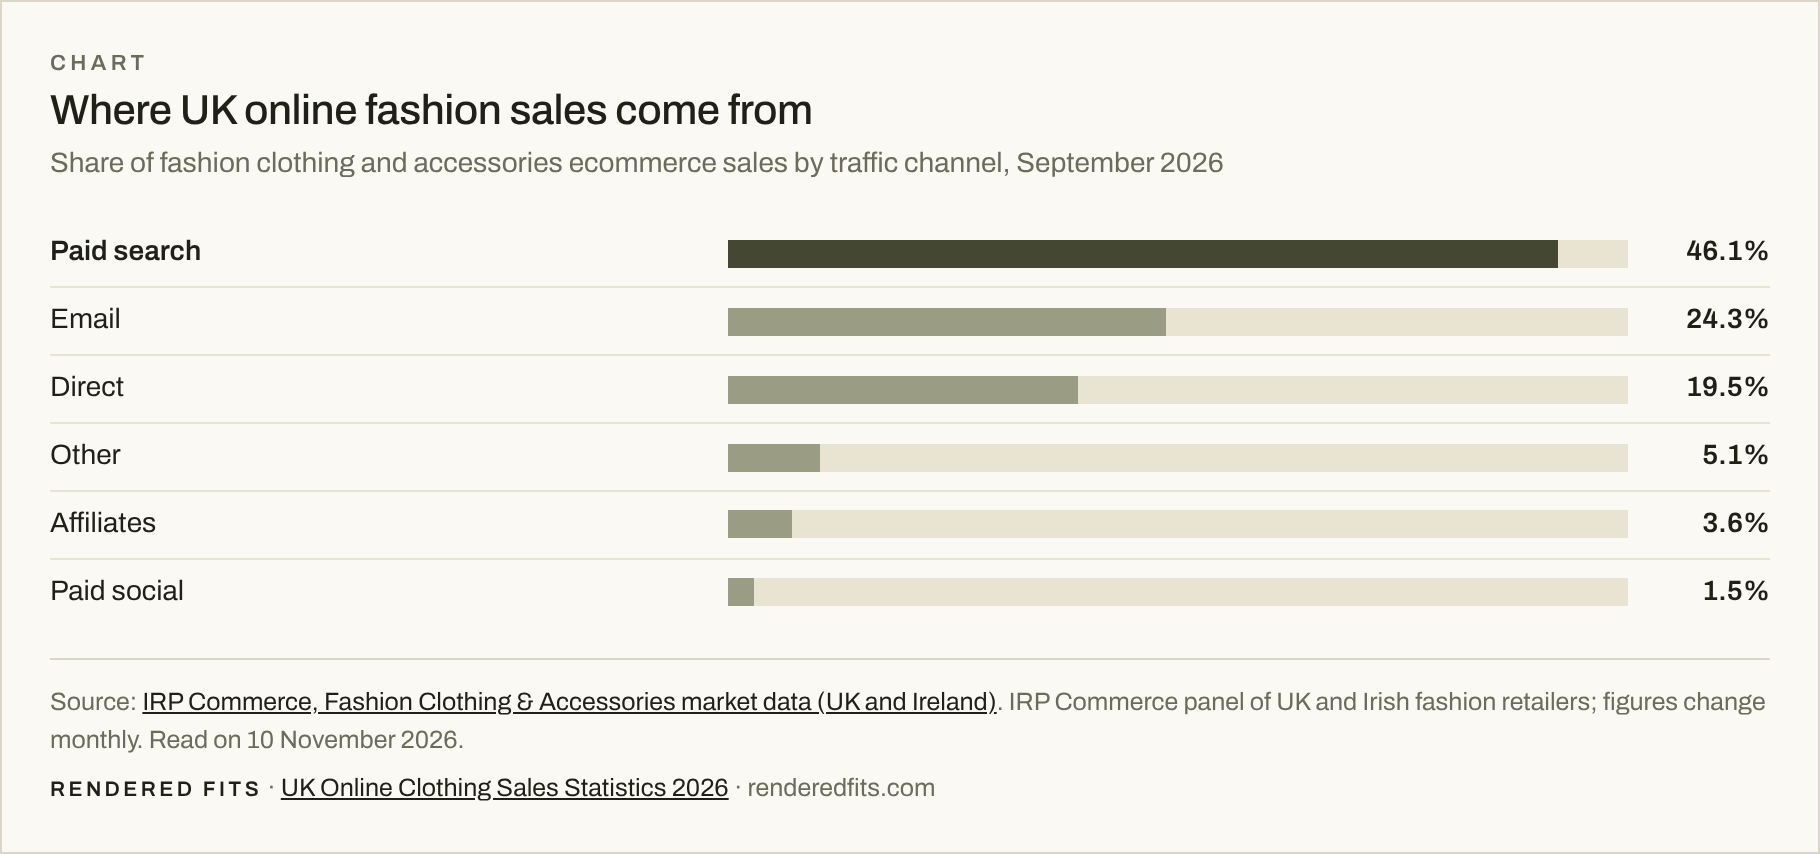
- 46.1%of UK and Irish online fashion sales came through paid searchIRP Commerce
- 1.62%UK and Ireland fashion ecommerce conversion rate, September 2026IRP Commerce
Headline figures
| Metric | Figure | Source |
|---|---|---|
| Share of textile, clothing and footwear store sales made online (Great Britain) | 28.2% (September 2026), 28.6% a year earlierSeptember 2026 | Office for National Statistics |
| Share of textile, clothing and footwear store sales made online, full year (Great Britain) | 28.3% (2025), 18.5% (2019), peak 33.1% (2021)2019 to 2025 | Office for National Statistics |
| Share of all retail sales made online (Great Britain) | 28.8%September 2026 | Office for National Statistics |
| Average weekly online sales, textile, clothing and footwear stores (Great Britain) | £317.1 million (September 2026), £328.1 million a year earlierSeptember 2026 | Office for National Statistics |
| UK and Ireland fashion ecommerce conversion rate | 1.62%September 2026 | IRP Commerce |
| UK and Ireland fashion average order value | £88.28September 2026 | IRP Commerce |
| UK and Ireland fashion ecommerce sales on mobile | 56.8%September 2026 | IRP Commerce |
| UK and Ireland fashion ecommerce sales from paid search | 46.1%September 2026 | IRP Commerce |
| UK and Ireland fashion ecommerce sales from international customers | 38.1%September 2026 | IRP Commerce |
| UK non-food return rate | 21% (2024), 19.5% (2025 forecast)2024 to 2025 | Retail Economics and ZigZag |
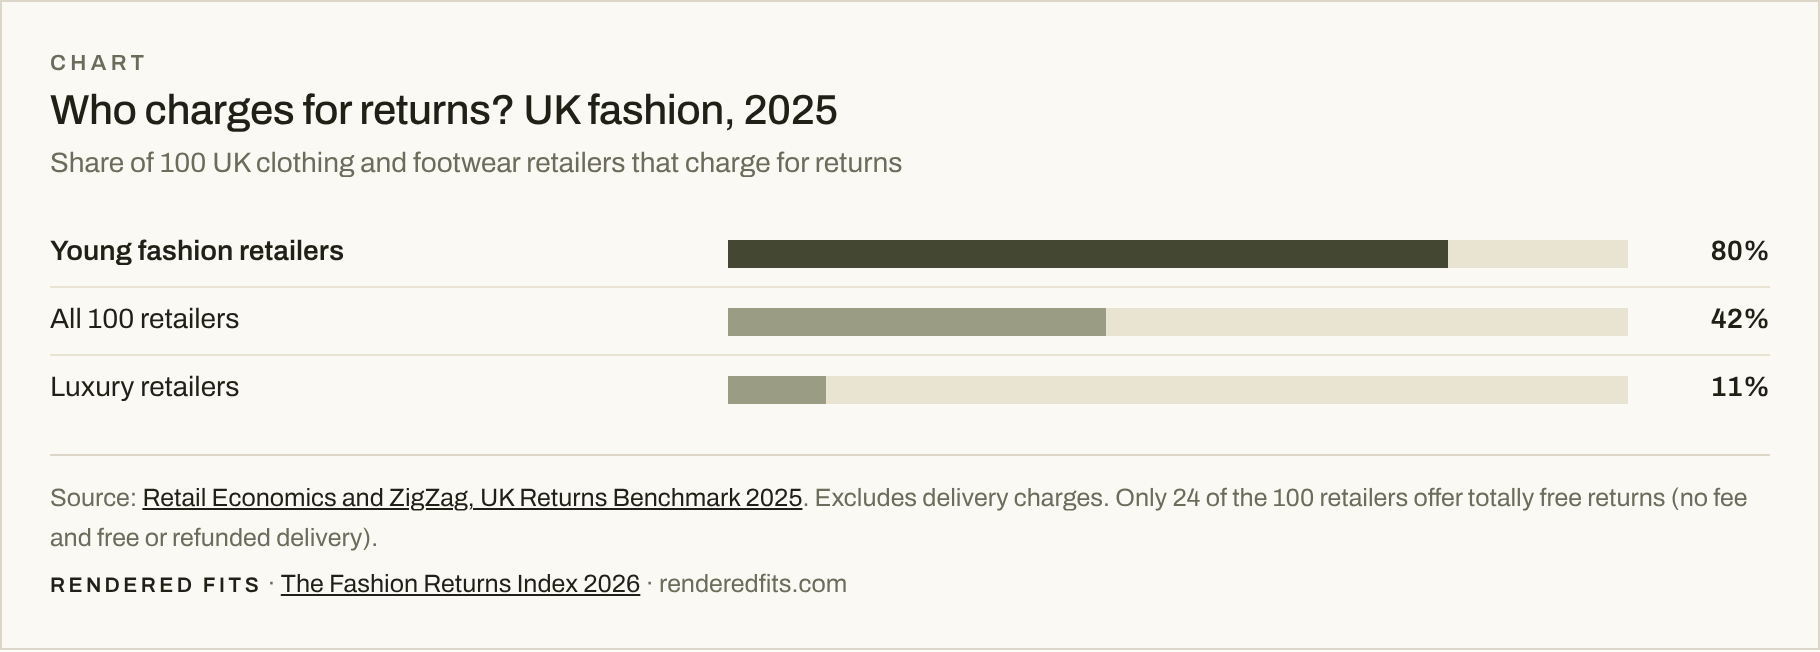
| UK clothing and footwear retailers charging for returns | 42%2025 | Retail Economics and ZigZag |
Is clothing bought online more than other goods?
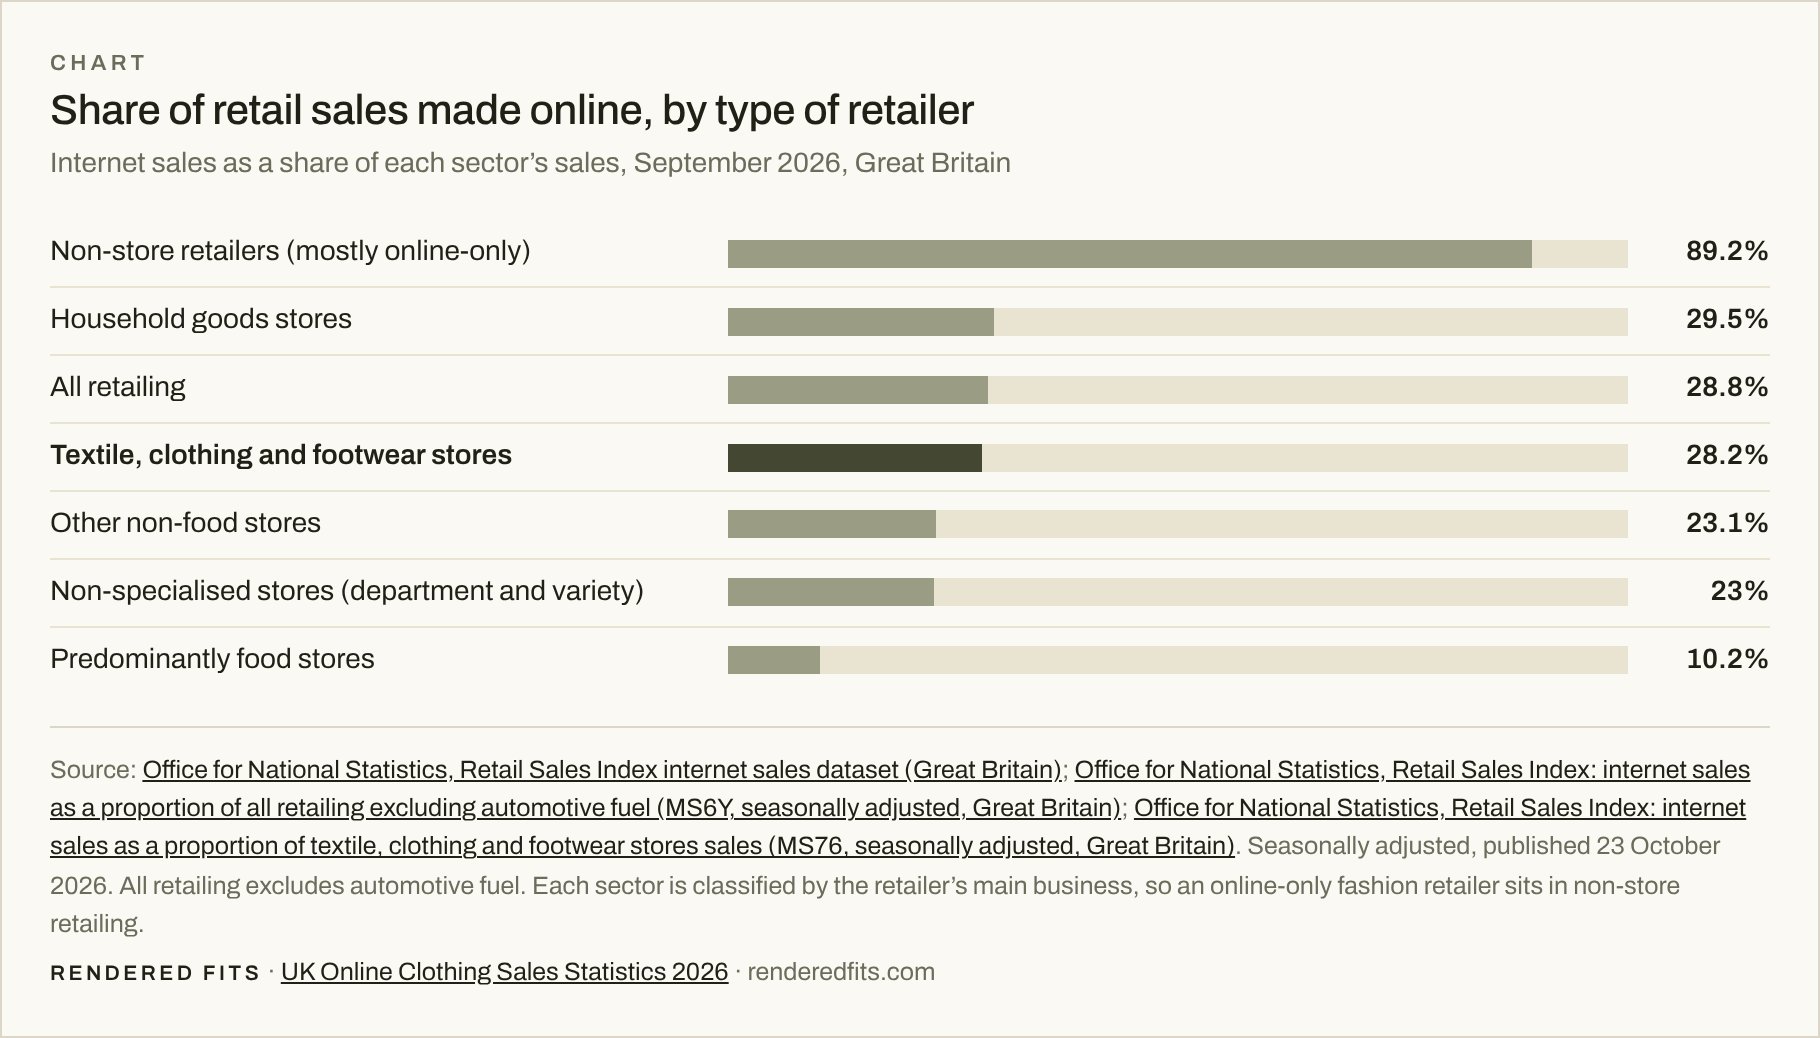
Not among store-based retailers: clothing stores' 28.2% online share in September 2026 was close to the all-retail average of 28.8% and just below household goods stores at 29.5%, though far above food stores at 10.2%.
Chart
Share of retail sales made online, by type of retailer
Internet sales as a share of each sector’s sales, September 2026, Great Britain
Source: Office for National Statistics, Retail Sales Index internet sales dataset (Great Britain); Office for National Statistics, Retail Sales Index: internet sales as a proportion of all retailing excluding automotive fuel (MS6Y, seasonally adjusted, Great Britain); Office for National Statistics, Retail Sales Index: internet sales as a proportion of textile, clothing and footwear stores sales (MS76, seasonally adjusted, Great Britain). Seasonally adjusted, published 23 October 2026. All retailing excludes automotive fuel. Each sector is classified by the retailer’s main business, so an online-only fashion retailer sits in non-store retailing.
Rendered Fits · Chart from UK Online Clothing Sales Statistics 2026, reviewed 10 November 2026
Embed, download or cite this chart
You may embed this chart or use the image with a link to this page. Please cite the original publisher for each figure. The figures belong to their publishers, who may not allow reuse or redistribution. Rendered Fits does not grant a Creative Commons or other open licence over those figures.
Across all retail, the ONS reports that the share of sales made online fell slightly from 28.9% in August to 28.8% in September 2026. Online spending was 6.8% higher than in September 2025 (ONS retail sales bulletin, September 2026).
Online clothing sales in 2026, month by month
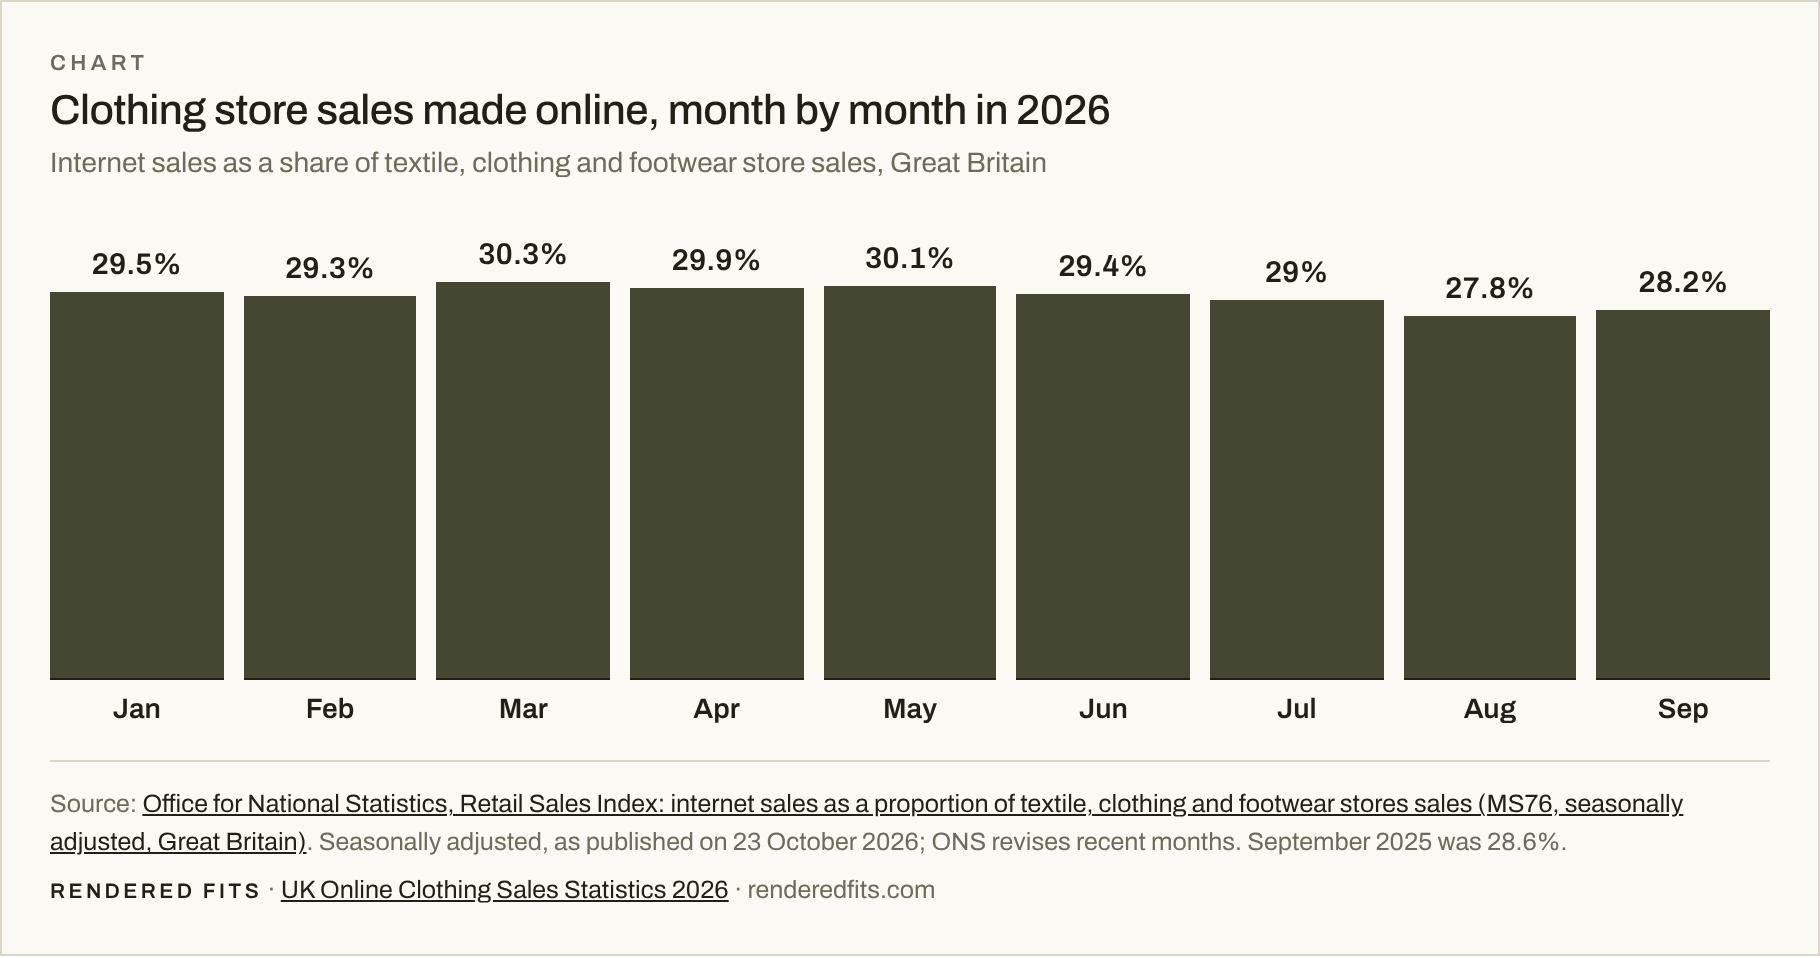
The online share of clothing store sales peaked at 30.3% in March 2026 and eased to 28.2% by September. Clothing stores sold an average of £317.1 million a week online in September, against £328.1 million a year earlier.
Chart
Clothing store sales made online, month by month in 2026
Internet sales as a share of textile, clothing and footwear store sales, Great Britain
- 29.5%Jan
- 29.3%Feb
- 30.3%Mar
- 29.9%Apr
- 30.1%May
- 29.4%Jun
- 29%Jul
- 27.8%Aug
- 28.2%Sep
Source: Office for National Statistics, Retail Sales Index: internet sales as a proportion of textile, clothing and footwear stores sales (MS76, seasonally adjusted, Great Britain). Seasonally adjusted, as published on 23 October 2026; ONS revises recent months. September 2025 was 28.6%.
Rendered Fits · Chart from UK Online Clothing Sales Statistics 2026, reviewed 10 November 2026
Embed, download or cite this chart
You may embed this chart or use the image with a link to this page. Please cite the original publisher for each figure. The figures belong to their publishers, who may not allow reuse or redistribution. Rendered Fits does not grant a Creative Commons or other open licence over those figures.
The ONS noted that online clothing retailers said warmer weather hit sales of autumn and winter ranges in September 2026. The ONS revises monthly figures as more retailers report, and the ONS advises reading them alongside three-month trends. We update this page after each monthly release; the next is due on 20 November 2026.
How UK shoppers buy fashion online
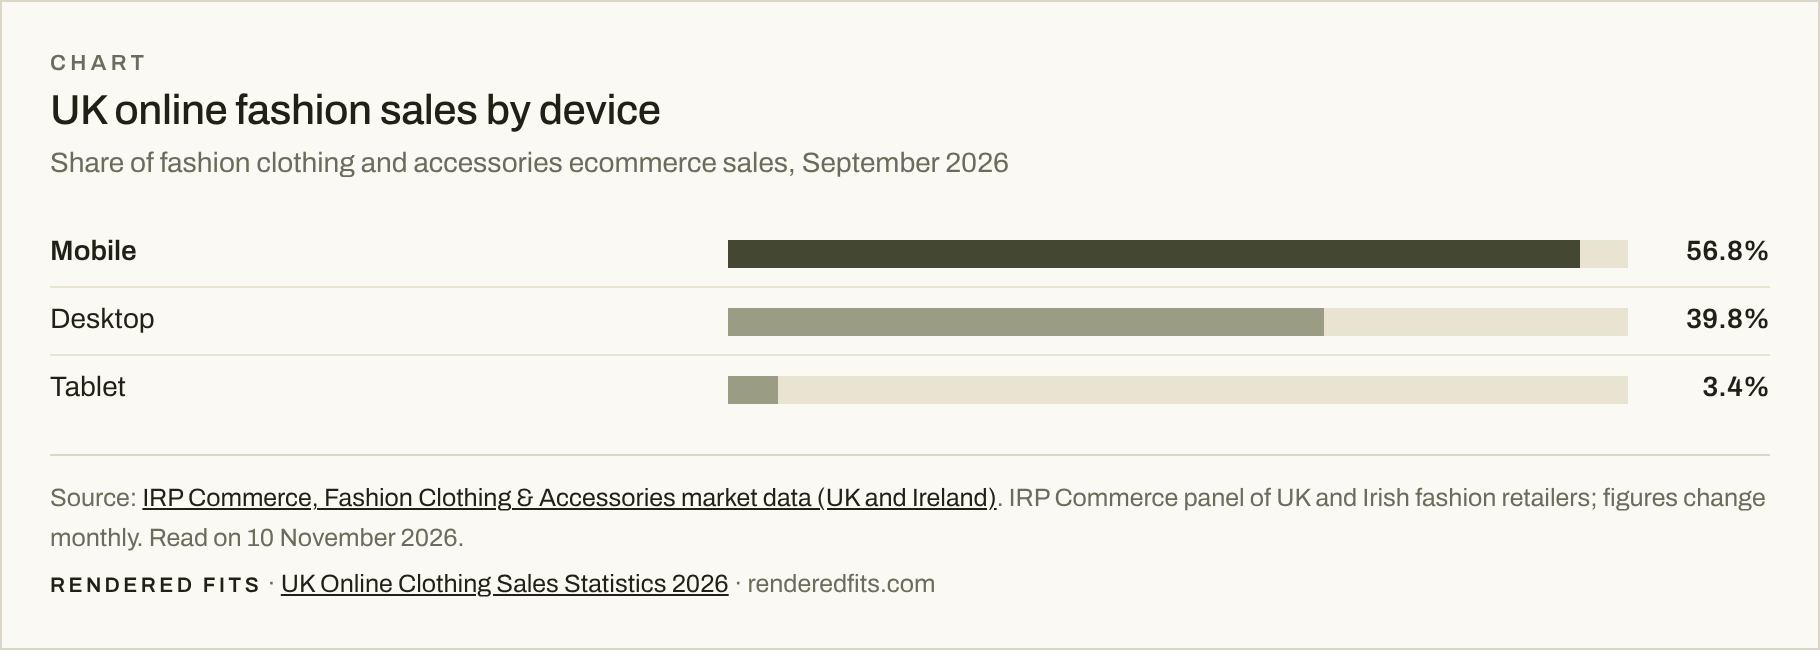
Mostly on mobile and mostly through paid search: in September 2026, 56.8% of UK and Irish online fashion sales were made on a phone, and 46.1% came through paid search, according to IRP Commerce's retailer panel.
Chart
UK online fashion sales by device
Share of fashion clothing and accessories ecommerce sales, September 2026
Source: IRP Commerce, Fashion Clothing & Accessories market data (UK and Ireland). IRP Commerce panel of UK and Irish fashion retailers; figures change monthly. Read on 10 November 2026.
Rendered Fits · Chart from UK Online Clothing Sales Statistics 2026, reviewed 10 November 2026
Embed, download or cite this chart
You may embed this chart or use the image with a link to this page. Please cite the original publisher for each figure. The figures belong to their publishers, who may not allow reuse or redistribution. Rendered Fits does not grant a Creative Commons or other open licence over those figures.
Chart
Where UK online fashion sales come from
Share of fashion clothing and accessories ecommerce sales by traffic channel, September 2026
Source: IRP Commerce, Fashion Clothing & Accessories market data (UK and Ireland). IRP Commerce panel of UK and Irish fashion retailers; figures change monthly. Read on 10 November 2026.
Rendered Fits · Chart from UK Online Clothing Sales Statistics 2026, reviewed 10 November 2026
Embed, download or cite this chart
You may embed this chart or use the image with a link to this page. Please cite the original publisher for each figure. The figures belong to their publishers, who may not allow reuse or redistribution. Rendered Fits does not grant a Creative Commons or other open licence over those figures.
IRP Commerce also reports for fashion clothing and accessories in September 2026:
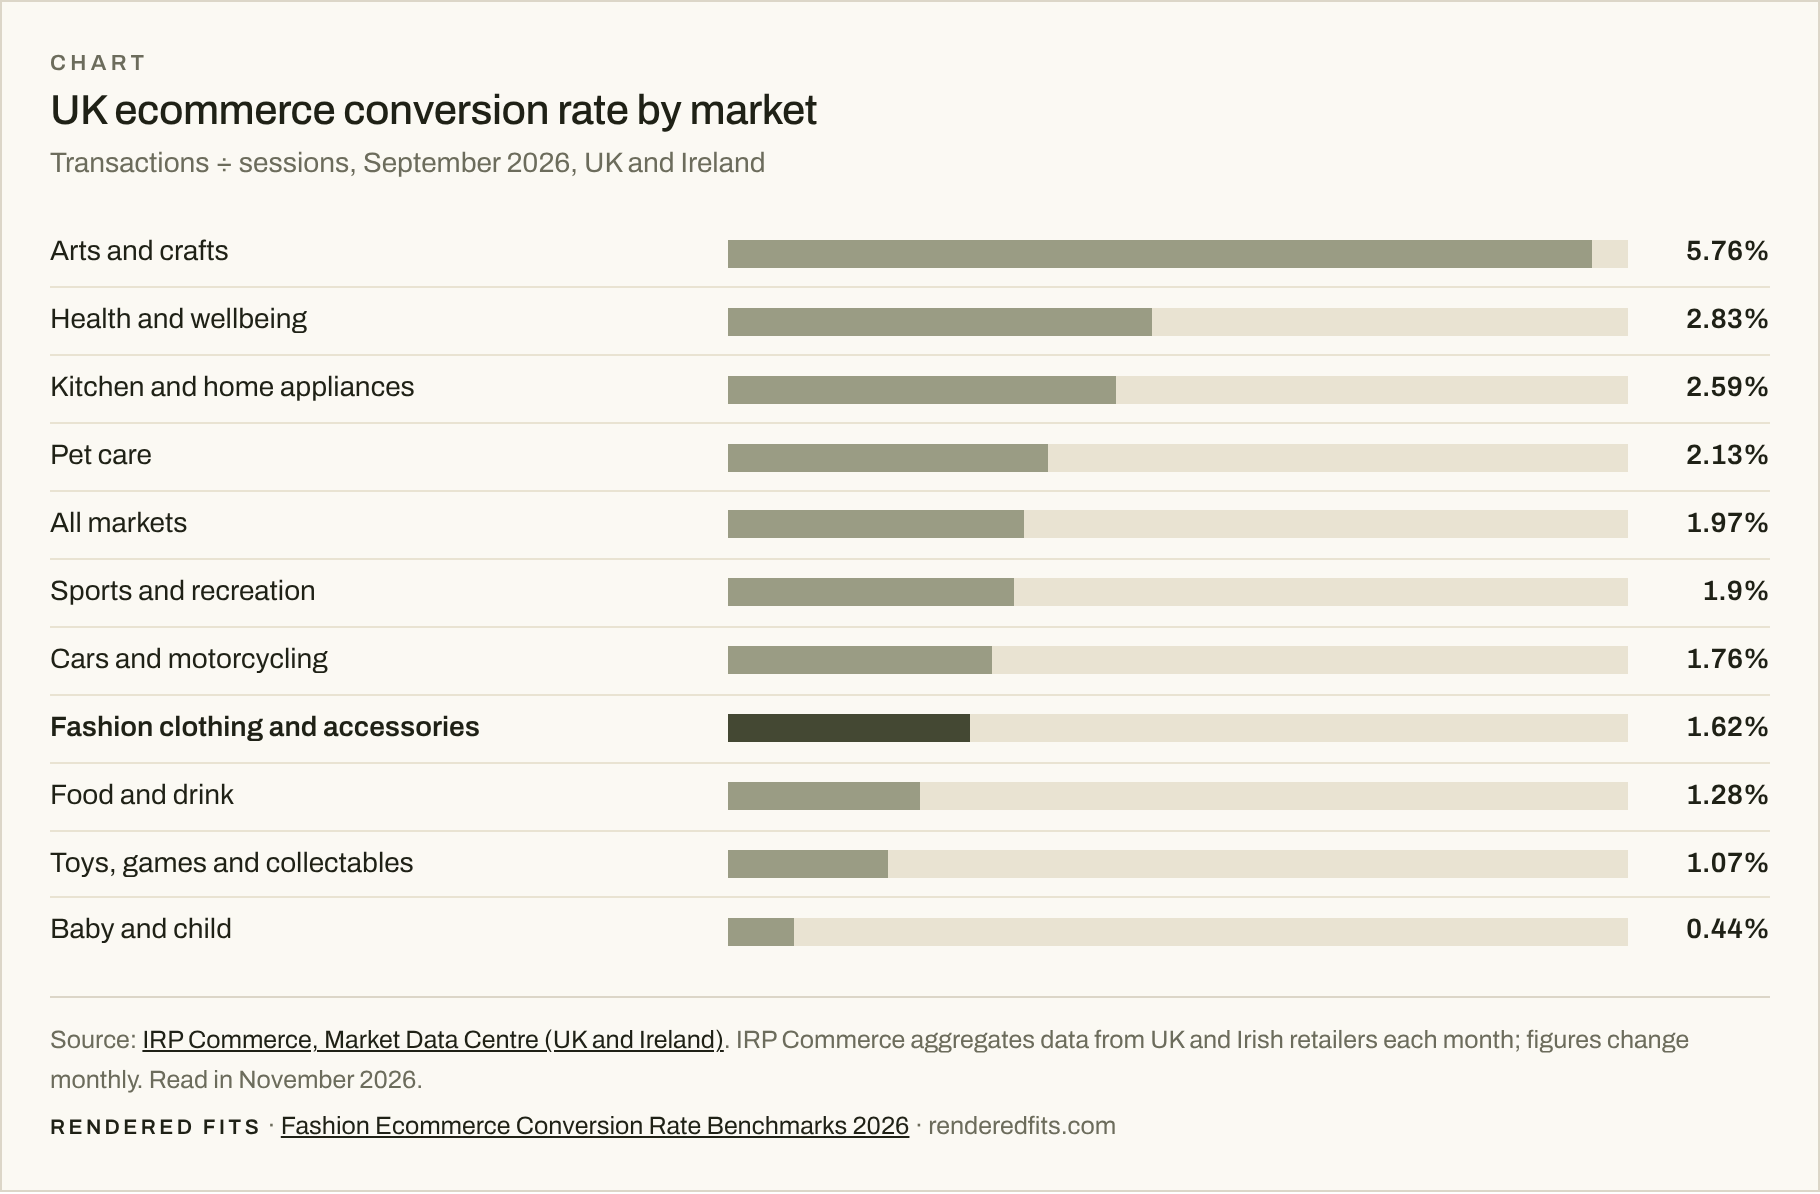
- A conversion rate of 1.62% of sessions, up from 1.29% a year earlier, and below the 1.97% average across retail markets.
- An average order value of £88.28 and an average item price of £59.44.
- International customers accounted for 38.1% of sales, up from 36.37% a year earlier.
- A bounce rate of 43.94%, up from 39.47%.
Chart
UK ecommerce conversion rate by market
Transactions ÷ sessions, September 2026, UK and Ireland
Source: IRP Commerce, Market Data Centre (UK and Ireland). IRP Commerce aggregates data from UK and Irish retailers each month; figures change monthly. Read in November 2026.
Rendered Fits · Chart from Fashion Ecommerce Conversion Rate Benchmarks 2026, reviewed 9 November 2026
Embed, download or cite this chart
You may embed this chart or use the image with a link to this page. Please cite the original publisher for each figure. The figures belong to their publishers, who may not allow reuse or redistribution. Rendered Fits does not grant a Creative Commons or other open licence over those figures.
More conversion benchmarks, by fashion category, are in fashion ecommerce conversion rate benchmarks 2026.
How many UK online clothing orders are returned?
Retail Economics and ZigZag put the UK non-food return rate at 21% in 2024, easing to 19.5% in 2025, with returns worth £26.7 billion in 2024. 42% of UK clothing and footwear retailers now charge for returns.
Chart
Who charges for returns? UK fashion, 2025
Share of 100 UK clothing and footwear retailers that charge for returns
Source: Retail Economics and ZigZag, UK Returns Benchmark 2025. Excludes delivery charges. Only 24 of the 100 retailers offer totally free returns (no fee and free or refunded delivery).
Rendered Fits · Chart from The Fashion Returns Index 2026, reviewed 9 November 2026
Embed, download or cite this chart
You may embed this chart or use the image with a link to this page. Please cite the original publisher for each figure. The figures belong to their publishers, who may not allow reuse or redistribution. Rendered Fits does not grant a Creative Commons or other open licence over those figures.
Charging has a cost of its own: Retail Economics found that 49% of UK shoppers, and six in ten Millennials, have abandoned a purchase over an unsatisfactory returns policy. For what each return costs a retailer, see the cost of returns 2026; for return rates in other countries, see the Fashion Returns Index.
Definitions and how this page is compiled
The ONS figures cover Great Britain, are seasonally adjusted, and measure online sales by retailers whose main business is clothing, textile and footwear stores.
- Source. The ONS Retail Sales Index, from its Monthly Business Survey of retailers. Series MS76 (online share, clothing stores), MS6Y (online share, all retailing excluding fuel) and MZXV (average weekly online sales, clothing stores), with other sectors from the internet sales dataset. Figures as published on 23 October 2026.
- Great Britain, not the UK. The Retail Sales Index excludes Northern Ireland. The IRP Commerce figures cover UK and Irish retailers; Retail Economics covers the UK.
- Store-based retailers only. Online-only retailers are counted in non-store retailing, whatever they sell.
- Revisions. The ONS revises recent months. When it does, we update the figures here and log the change.
ONS data are Crown copyright, reused under the Open Government Licence v3.0. Corrections: data@renderedfits.com.
Change log
- 10 November 2026: first edition, with ONS data to September 2026 (published 23 October 2026) and IRP Commerce data for September 2026.
How to cite this page
Please cite the original publication for each figure, and this page as the place you found it. Rendered Fits does not grant a Creative Commons or other open licence over the figures, because those rights sit with the original publishers. Last reviewed 10 November 2026; we review the page every quarter.
- APA
Stones, S. (2026, November 10). UK Online Clothing Sales Statistics 2026. Rendered Fits. https://www.renderedfits.com/uk-online-clothing-sales-statistics-2026/- Harvard
Stones, S. (2026) UK Online Clothing Sales Statistics 2026. Rendered Fits. Available at: https://www.renderedfits.com/uk-online-clothing-sales-statistics-2026/ (Accessed: 10 November 2026).- Link (HTML)
<a href="https://www.renderedfits.com/uk-online-clothing-sales-statistics-2026/">UK Online Clothing Sales Statistics 2026</a> (Rendered Fits)
Sources
- Office for National Statistics, internet sales as a proportion of textile, clothing and footwear stores sales, series MS76 (published 23 October 2026)
- Office for National Statistics, internet sales as a proportion of all retailing excluding automotive fuel, series MS6Y (published 23 October 2026)
- Office for National Statistics, internet average weekly sales, textile, clothing and footwear stores, series MZXV (published 23 October 2026)
- Office for National Statistics, Retail Sales Index internet sales dataset (released 23 October 2026)
- Office for National Statistics, Retail sales, Great Britain: September 2026 (23 October 2026)
- IRP Commerce, Fashion Clothing & Accessories market data, UK and Ireland (September 2026, read 10 November 2026)
- IRP Commerce, Market Data Centre, all markets (September 2026)
- Retail Economics and ZigZag, UK Returns Benchmark 2025
Every figure on this page links to the publication it comes from. Rendered Fits does not publish a sales figure of its own. Last reviewed 10 November 2026 by Sienna Stones.
Frequently asked questions
What percentage of clothing is bought online in the UK?
Clothing, textile and footwear retailers in Great Britain made 28.2% of their sales online in September 2026 and 28.3% across 2025, according to the ONS. That counts store-based retailers and their websites; online-only retailers are counted separately, so the share of all clothing bought online is higher.
How has online clothing shopping changed since the pandemic?
The ONS online share of clothing store sales rose from 18.5% in 2019 to a peak of 33.1% in 2021, fell to 26.0% in 2022 as shops reopened, and has risen each year since, to 28.3% in 2025.
Is more clothing bought online than other goods?
Among store-based retailers, no. In September 2026 clothing stores made 28.2% of sales online, close to the 28.8% average for all retail and just below household goods stores (29.5%), but far above food stores (10.2%).
How much do UK clothing stores sell online each week?
An average of £317.1 million a week in September 2026, seasonally adjusted, against £328.1 million in September 2025, according to the ONS. This covers Great Britain and store-based clothing, textile and footwear retailers.
Do UK shoppers buy fashion on mobile or desktop?
Mostly mobile. IRP Commerce's panel of UK and Irish fashion retailers recorded 56.8% of online fashion sales on mobile in September 2026, 39.8% on desktop and 3.4% on tablet.
What is the conversion rate for UK online fashion?
IRP Commerce reports 1.62% of sessions for UK and Irish fashion clothing and accessories retailers in September 2026, up from 1.29% a year earlier, with an average order value of £88.28.
Why do ONS figures say Great Britain rather than the UK?
The ONS Retail Sales Index surveys retailers in Great Britain and does not include Northern Ireland, so its online share figures are for Great Britain.
About Rendered Fits. Rendered Fits is a Shopify app for fashion brands that recommends a size for supported products from the brand's own size chart, and can show shoppers an optional AI try-on preview. There is a Free plan (one product, 5 try-ons a month, with a PREVIEW watermark). Complete is $349 a month plus any applicable taxes, with a 14-day trial of 50 try-ons in total, then 1,000 try-ons per paid cycle. Extra try-ons cost $0.50 each, but only if you turn them on and set a spending cap. Enterprise is $999 a month plus any applicable taxes, with 5,000 try-ons per paid cycle, then $0.35 each extra on the same terms, and no trial.
Related: Fashion ecommerce conversion rate benchmarks · The cost of returns 2026 · Fashion Returns Index 2026 · Fashion return statistics 2026 · Size recommendation app for Shopify