Fashion ecommerce conversion rate benchmarks 2026
The median fashion ecommerce conversion rate is 2.4% across 500 brands, from 7.4% for accessories to 0.8% for menswear. In the UK, fashion sites converted 1.62% of sessions in September 2026, below the 1.97% average for all markets. Every benchmark on this page links to the data it comes from.
Director Sienna Stones was interviewed by Vogue College of Fashion (2 June 2026)
Key figures
Fashion converts at around 1.5% to 2.5% of sessions, and the spread between categories is wider than the spread between benchmarks.
- 2.4%median conversion rate across 500 fashion brandsCentra, 2025
- 1.62%UK and Ireland fashion conversion rate, September 2026 (1.29% a year earlier)IRP Commerce
- 0.8%median conversion rate for men’s fashion, the lowest categoryCentra, 2025
- £88.28average order value, UK and Ireland fashion, September 2026IRP Commerce
- £1.19revenue per session, UK and Ireland fashion, September 2026IRP Commerce
- 70.22%average online cart abandonment, all categoriesBaymard Institute
Benchmark table
| Metric | Figure | Source |
|---|---|---|
| Median conversion rate, 500 fashion brands | 2.4%published 28 February 2025 | Centra |
| Median conversion rate, women’s fashion | 3.6%published 28 February 2025 | Centra |
| Median conversion rate, men’s fashion | 0.8%published 28 February 2025 | Centra |
| UK and Ireland fashion clothing and accessories conversion rate | 1.62% (September 2026), up from 1.29% (September 2025)September 2026 | IRP Commerce |
| UK and Ireland conversion rate, all markets | 1.97%September 2026 | IRP Commerce |
| UK and Ireland fashion average order value | £88.28September 2026 | IRP Commerce |
| UK and Ireland fashion average item price | £59.44September 2026 | IRP Commerce |
| UK and Ireland fashion revenue per session | £1.19September 2026 | IRP Commerce |
| UK and Ireland fashion bounce rate | 43.94%September 2026 | IRP Commerce |
| Average documented online cart abandonment rate | 70.22%updated 22 September 2025 | Baymard Institute |
What is a good conversion rate for a clothing brand?
Above your category's median: about 3.6% for womenswear, 2.2% for footwear and 0.8% for menswear in Centra's study, so a menswear store at 1.5% is doing well while an accessories store at 1.5% is not.
Chart
Fashion ecommerce conversion rate by category
Median conversion rate across 500 fashion brands
Source: Centra, Conversion rate in fashion ecommerce: benchmarks from 500 brands. Medians from Centra's own platform data. Centra does not publish how sessions are counted, so compare with your own figure only roughly.
Rendered Fits · Chart from Fashion Ecommerce Conversion Rate Benchmarks 2026, reviewed 9 November 2026
Embed, download or cite this chart
You may embed this chart or use the image with a link to this page. Please cite the original publisher for each figure. The figures belong to their publishers, who may not allow reuse or redistribution. Rendered Fits does not grant a Creative Commons or other open licence over those figures.
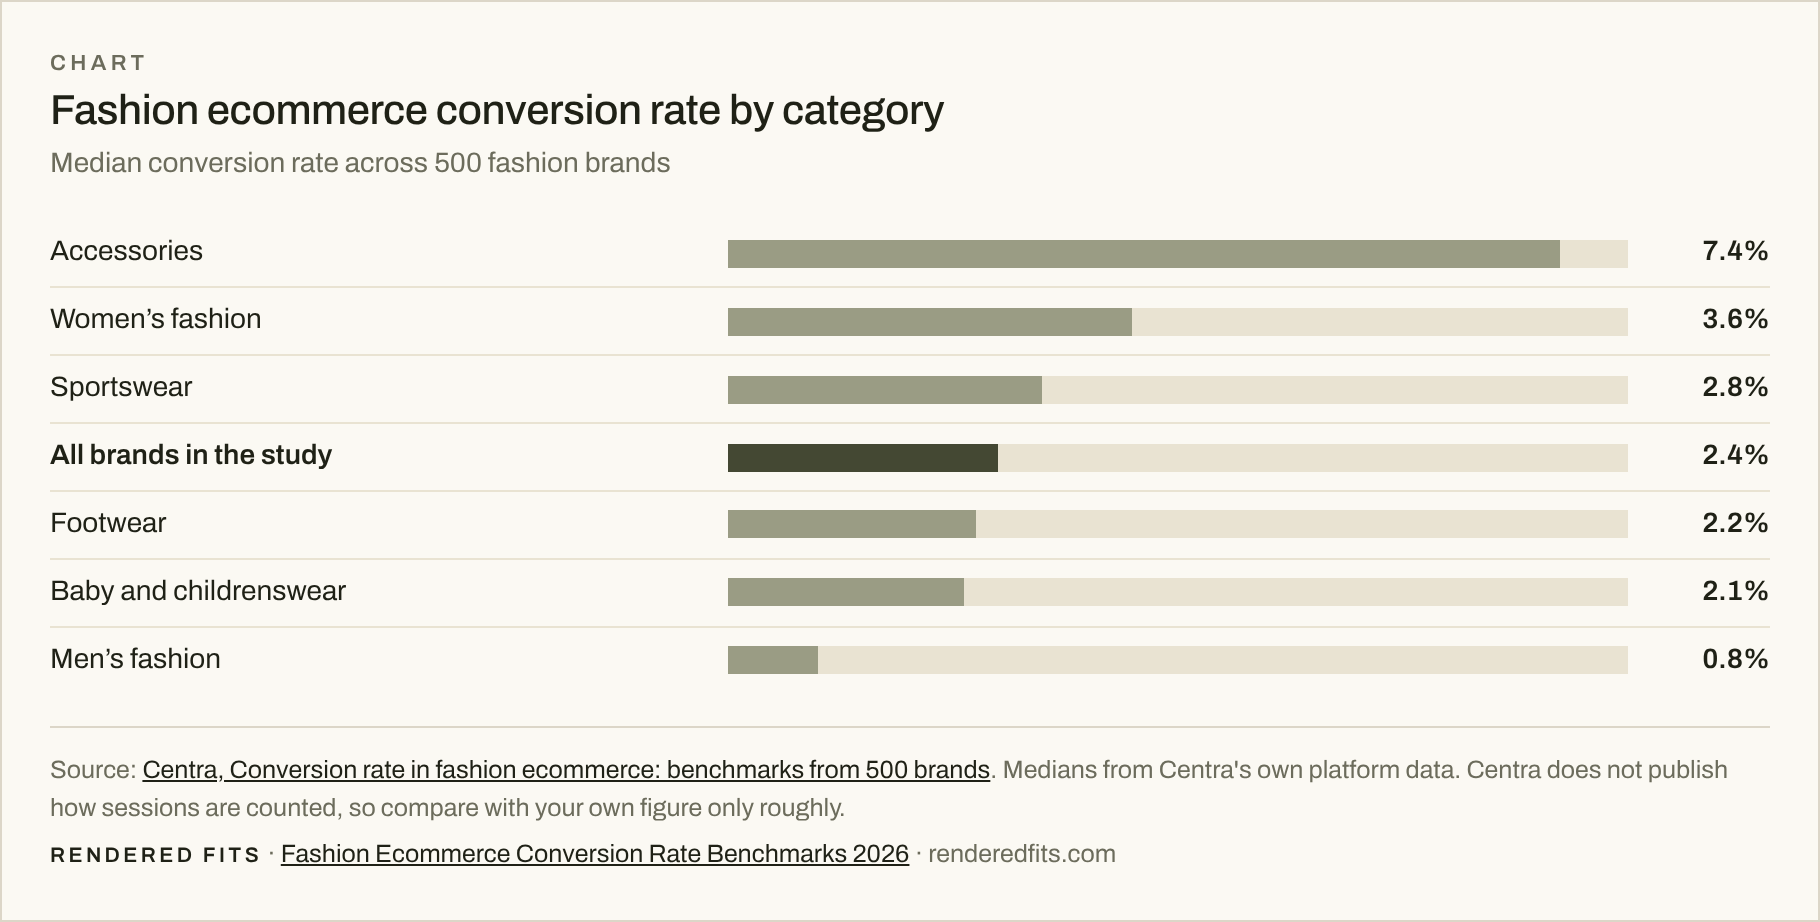
Accessories convert best because they are cheaper and carry no size risk. Menswear converts worst, at a third of the all-brand median; Centra's figures do not say why. Compare your store with its own category, not with an all-fashion average.
Fashion conversion rate in the UK
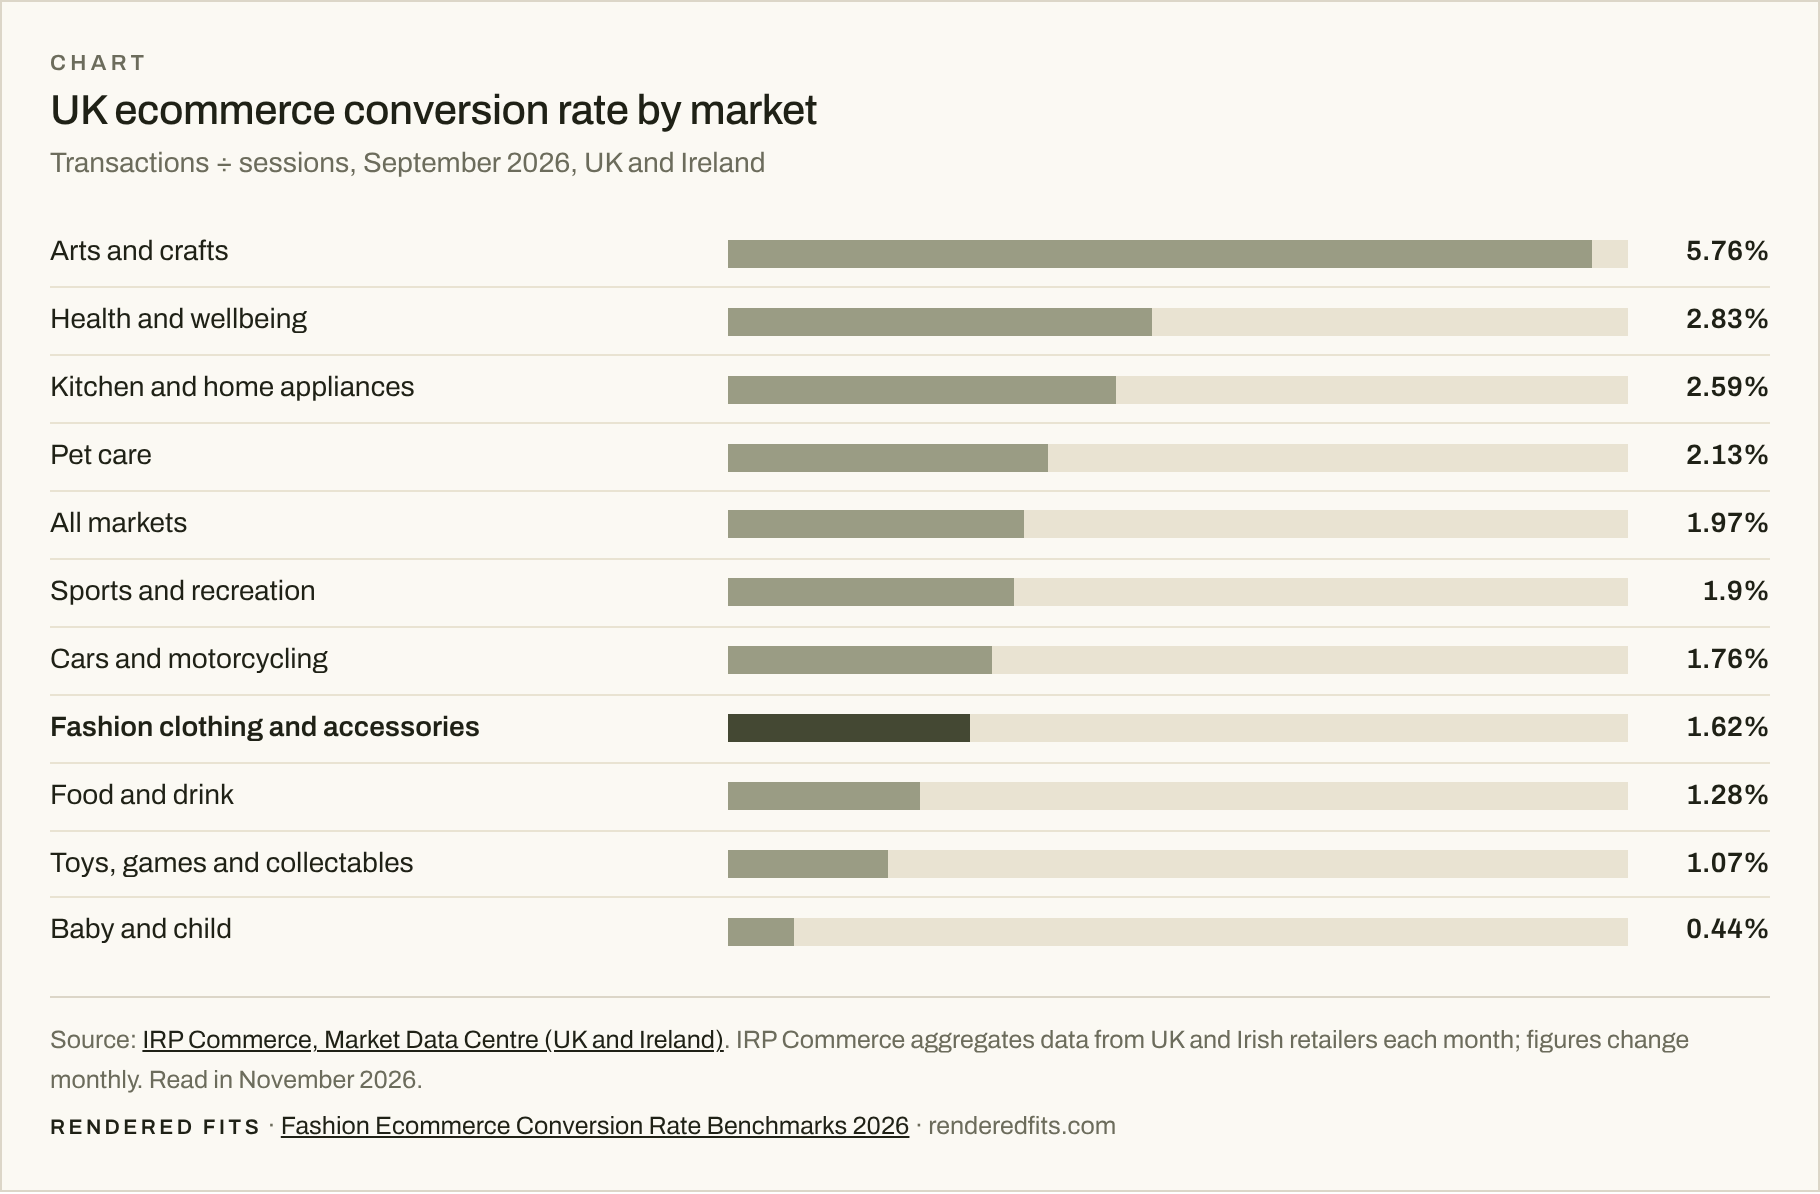
UK and Irish fashion sites converted 1.62% of sessions in September 2026, up from 1.29% in September 2025, and rank seventh of ten retail markets.
Chart
UK ecommerce conversion rate by market
Transactions ÷ sessions, September 2026, UK and Ireland
Source: IRP Commerce, Market Data Centre (UK and Ireland). IRP Commerce aggregates data from UK and Irish retailers each month; figures change monthly. Read in November 2026.
Rendered Fits · Chart from Fashion Ecommerce Conversion Rate Benchmarks 2026, reviewed 9 November 2026
Embed, download or cite this chart
You may embed this chart or use the image with a link to this page. Please cite the original publisher for each figure. The figures belong to their publishers, who may not allow reuse or redistribution. Rendered Fits does not grant a Creative Commons or other open licence over those figures.
IRP Commerce also reports, for fashion clothing and accessories in September 2026:
- Average order value of £88.28 (down 2.09% on a year earlier) and an average item price of £59.44.
- Revenue per session of £1.19 and marketing cost per session of £0.11, with marketing costs equal to 9.04% of revenue.
- A bounce rate of 43.94%.
- Paid search brought 46.1% of sales, email 24.3% and direct visits 19.5%.
IRP Commerce publishes these figures monthly from its retailer panel, so they move from month to month. We re-read them at each quarterly review. For the share of clothing bought online, from ONS data, see UK online clothing sales statistics 2026.
Why do conversion benchmarks disagree?
Because they divide different things by different things: orders by sessions or by users, medians or averages, across different sets of stores.
- Sessions or users. IRP Commerce divides transactions by sessions. A rate based on unique users is higher, because one person can visit several times before buying.
- Median or average. Centra reports medians, which a few very high-converting stores cannot pull up. Averages usually sit higher.
- Which stores. Centra measures brands on its own platform; IRP Commerce measures a panel of UK and Irish retailers. Neither is a census of all fashion stores.
- Traffic mix. Paid search, email and returning visitors convert differently, so a store's channel mix moves its rate as much as its product pages do.
Figures circulating online for mobile and desktop conversion in fashion rarely name a primary source, so we do not list a device split. Check your own analytics by device instead.
How to calculate your conversion rate
Divide orders by sessions over the same period and multiply by 100: 250 orders from 10,000 sessions is a 2.5% conversion rate.
- Pick one definition (orders ÷ sessions is the most common) and keep it.
- Exclude internal, bot and test traffic.
- Split by category, device and channel before comparing with a benchmark.
- Compare the same weeks year on year, because fashion is seasonal.
Return-adjusted conversion: the rate that pays
In fashion a sale is not finished until the return window closes, so also track the share of sessions that end in an order the customer keeps: conversion rate × (1 − return rate).
This is arithmetic, not a published benchmark. As an illustration only, combining two figures from different studies, a 2.4% conversion rate and a 24.4% order return rate (the Coresight figure for US online apparel) would leave about 1.8% of sessions ending in a kept order. Use your own conversion and return rates.
Calculate your kept-order rate
Enter your own figures. Nothing is sent anywhere.
Lowering the return rate raises this number just as raising conversion does, and in clothing both often start with clearer size information before purchase.
The Fashion Returns Index 2026 lists the published return rates, and virtual try-on conversion statistics covers what is and is not known about try-on and conversion.
How this page is compiled
We list a benchmark only if its publisher names the data behind it, and we link to that publication. Agency and vendor blog figures with no named data source are left out, including the widely repeated device splits. Each figure is re-read every quarter and changes are logged here. Corrections: data@renderedfits.com.
Change log
- 9 November 2026: first edition, with Centra's category medians and IRP Commerce's September 2026 UK and Ireland data.
How to cite this page
Please cite the original publication for each figure, and this page as the place you found it. Rendered Fits does not grant a Creative Commons or other open licence over the figures, because those rights sit with the original publishers. Last reviewed 9 November 2026; we review the page every quarter.
- APA
Stones, S. (2026, November 9). Fashion Ecommerce Conversion Rate Benchmarks 2026. Rendered Fits. https://www.renderedfits.com/fashion-ecommerce-conversion-rate-2026/- Harvard
Stones, S. (2026) Fashion Ecommerce Conversion Rate Benchmarks 2026. Rendered Fits. Available at: https://www.renderedfits.com/fashion-ecommerce-conversion-rate-2026/ (Accessed: 9 November 2026).- Link (HTML)
<a href="https://www.renderedfits.com/fashion-ecommerce-conversion-rate-2026/">Fashion Ecommerce Conversion Rate Benchmarks 2026</a> (Rendered Fits)
Sources
- Centra, Conversion rate in fashion ecommerce: benchmarks from 500 brands (28 February 2025)
- IRP Commerce, Fashion Clothing & Accessories market data, UK and Ireland (September 2026, read 9 November 2026)
- IRP Commerce, Market Data Centre, all markets (September 2026, read 9 November 2026)
- Baymard Institute, cart abandonment rate statistics (average of 50 studies, updated 22 September 2025)
- Coresight Research, The True Cost of Apparel Returns (6 March 2023)
Every figure on this page links to the publication it comes from. Rendered Fits does not publish a conversion figure of its own. Last reviewed 9 November 2026 by Sienna Stones.
Frequently asked questions
What is the average conversion rate for fashion ecommerce?
Centra's study of 500 fashion brands puts the median at 2.4%. IRP Commerce measured 1.62% of sessions for UK and Irish fashion sites in September 2026. Benchmarks differ because they use different stores, medians or averages, and sessions or users.
What is a good conversion rate for a clothing brand?
One above the median for your category. In Centra's study that is 3.6% for women's fashion, 2.8% for sportswear, 2.2% for footwear and 0.8% for men's fashion, while accessories reach 7.4%.
Why is menswear conversion so low?
Centra's median for men's fashion is 0.8%, a third of the all-brand median. Centra does not give a reason. Benchmark a menswear store against menswear, not all fashion.
What is the fashion conversion rate in the UK?
IRP Commerce reports 1.62% of sessions for fashion clothing and accessories in the UK and Ireland in September 2026, up from 1.29% a year earlier, against 1.97% across all markets.
How do you calculate ecommerce conversion rate?
Divide orders by sessions for the same period and multiply by 100. For example, 250 orders from 10,000 sessions is a 2.5% conversion rate. Keep one definition and compare like with like.
Should returns be counted in conversion rate?
Conversion rate itself counts orders, not kept orders. In fashion it helps to track a second figure, conversion rate multiplied by one minus the return rate, which shows how many sessions end in a sale the customer keeps.
About Rendered Fits. Rendered Fits is a Shopify app for fashion brands that recommends a size for supported products from the brand's own size chart, and can show shoppers an optional AI try-on preview. There is a Free plan (one product, 5 try-ons a month, with a PREVIEW watermark). Complete is $349 a month plus any applicable taxes, with a 14-day trial of 50 try-ons in total, then 1,000 try-ons per paid cycle. Extra try-ons cost $0.50 each, but only if you turn them on and set a spending cap. Enterprise is $999 a month plus any applicable taxes, with 5,000 try-ons per paid cycle, then $0.35 each extra on the same terms, and no trial.
Related: Fashion Returns Index 2026 · UK online clothing sales statistics 2026 · UK online clothing sales statistics 2026 · Virtual try-on conversion statistics · Fashion return statistics 2026 · Virtual try-on ROI calculator · Size recommendation app for Shopify